
BI Softpro
BI SOFTPRO - Subsystem for creating interactive graphical representations of key information, which is displayed in the form of widgets and graphs.
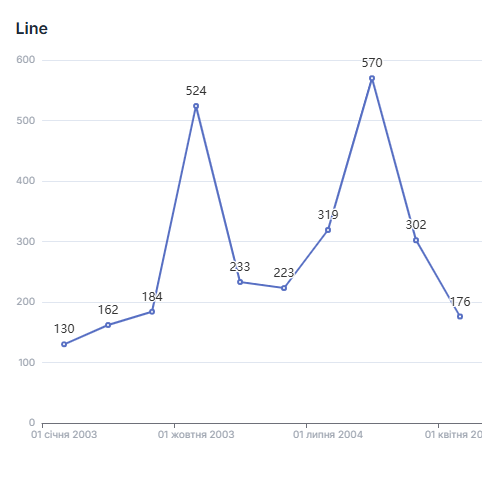
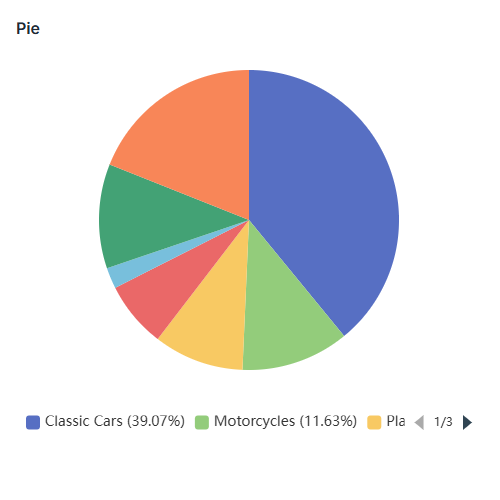
Widgets
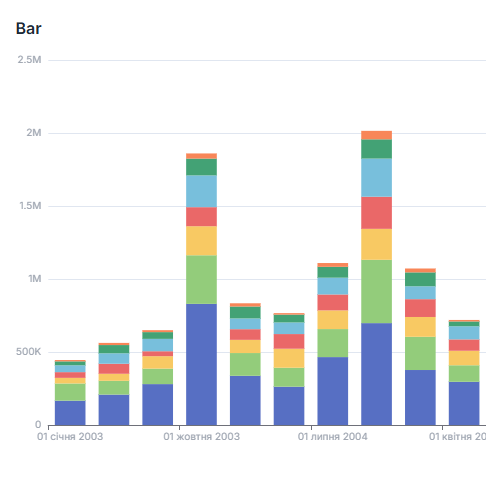

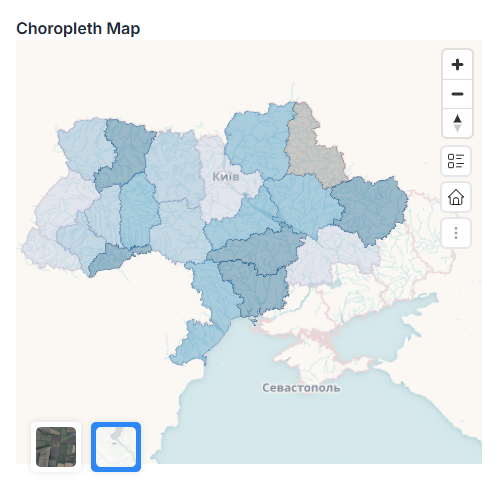
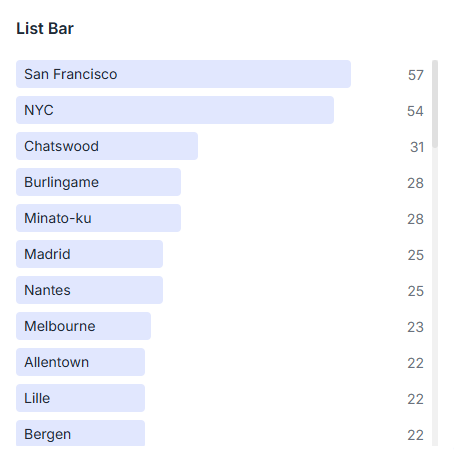
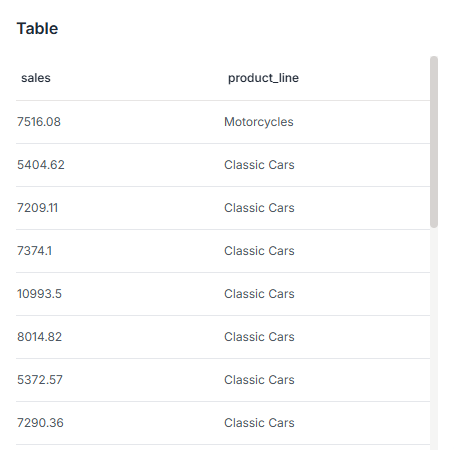
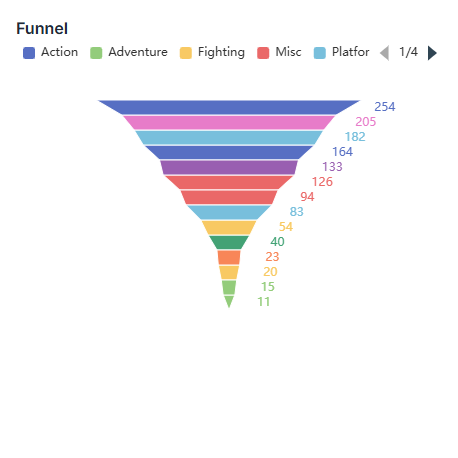
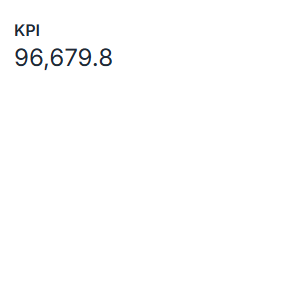
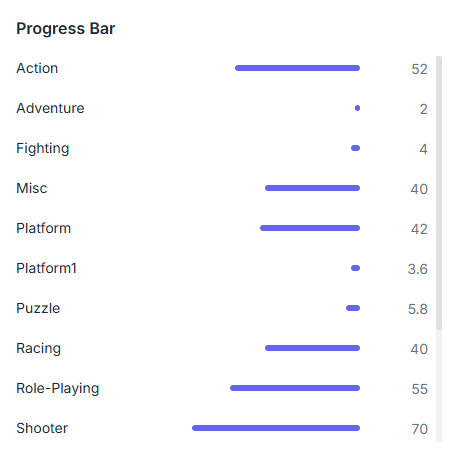
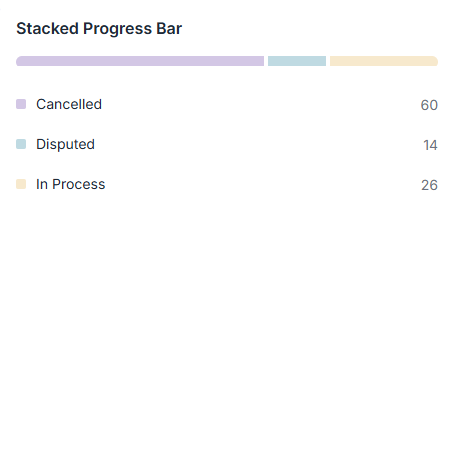
Features
Softpro BI is an open-source data visualization library.
Editor
Create custom dashboards in BI Editor
Filters
A flexible filtering system for data visualization.
Controls
Switch filtering modes and export the chart with a single click.
Data import
Import from a file, SQL, or create your own data table.
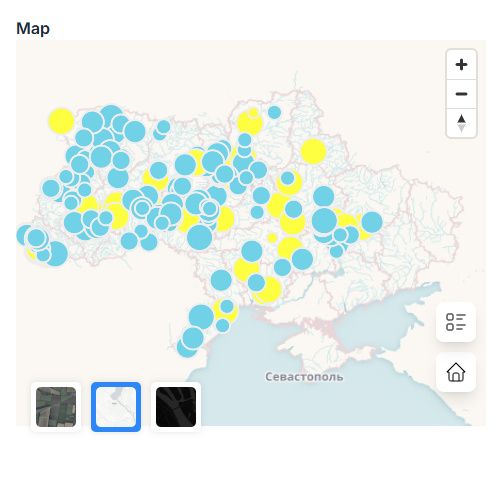
Success Stories
Ukrainian cities are achieving tangible results through collaboration with us—from accurate accounting and optimization of urban resources to improved planning and efficient management. Discover how our solutions are transforming reality.
Flexible rules for creating dashboards that perfectly match your unique needs.
Build dashboards in the BI Editor.
- Wide selection of widgets
- User-friendly interface
- Configuration in YAML
A flexible filtering system for data visualization.
- Dashboard filters
- Widget filters
- Export dashboard as an image


Write us
Encountered a technical issue? Want to provide feedback on a beta feature? Need information about our business plan? Let us know.